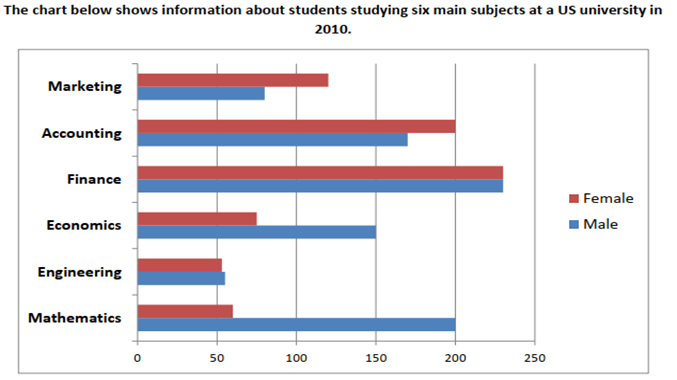
IELTS WRITING TASK 1 – The chart below shows information about students studying six main subjects at a US university in 2010.
The bar chart illustrates the number of male and female students selecting six major subjects in a US college in the year 2010It is clear that Finance was the most attractive area of qualification among both sexes in the year 2010, while the opposite was true for Engineering. In addition, the biggest difference was in …