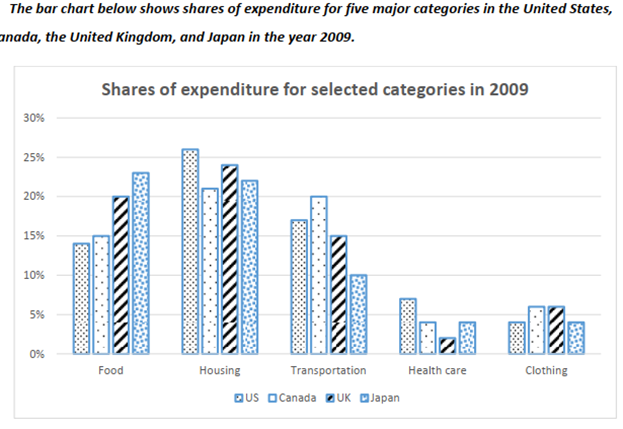
The bar chart illustrates the consumer spending on five main items in four different countries in 2009.
It is clear that the largest proportion of consumer spending in all countries, except for Japan, went onhousing. On the other hand, the health care and clothing categories provided the lowest figures in 2009.
As can be seen from the chart, the US expenditure on housing was highest, at about 26%, and Healthcare, at nearly 7%, and the same was true for Japan’s spending on Food with nearly 23%. Likewise, theproportion of spending on transportation was significantly higher in Canada, at about 20%, than in anyof the other countries.
Out of the four nations, Canada had the lowest percentage of consumer expenditure on housing, atnearly 14%, whereas the Japanese spent the lowest amount of money on transportation, at around10%. However, US and UK had slightly higher figures for these categories, but the lowest figure for food, at nearly 14%. Additionally, the figures for clothing in all nations were relatively similar, hovering at 5%